UCSC Genome Browser · Tutorial 1

The Basics

Getting oriented, navigating, tracks, and putting your own data on the Browser

A hands-on introduction · genome.ucsc.edu

How to follow along

  • Examples are shown on human GRCh38 / hg38 throughout.
  • note markers flag what also applies to hg19 and other assemblies.
  • Examples are cancer / oncology-focused.
Try it Green = try it yourself.
Demo Blue = demo + follow along.
Open now genome.ucsc.edu: keep this tab open.

What is the UCSC Genome Browser?

  • A free web tool to view a genome and everything annotated on it, at any zoom.
  • Each row of data is a track; hundreds come pre-loaded per genome.
  • Add your own data and share a live view, both later in this tutorial.
  • Backed by databases at UCSC; nothing to install.
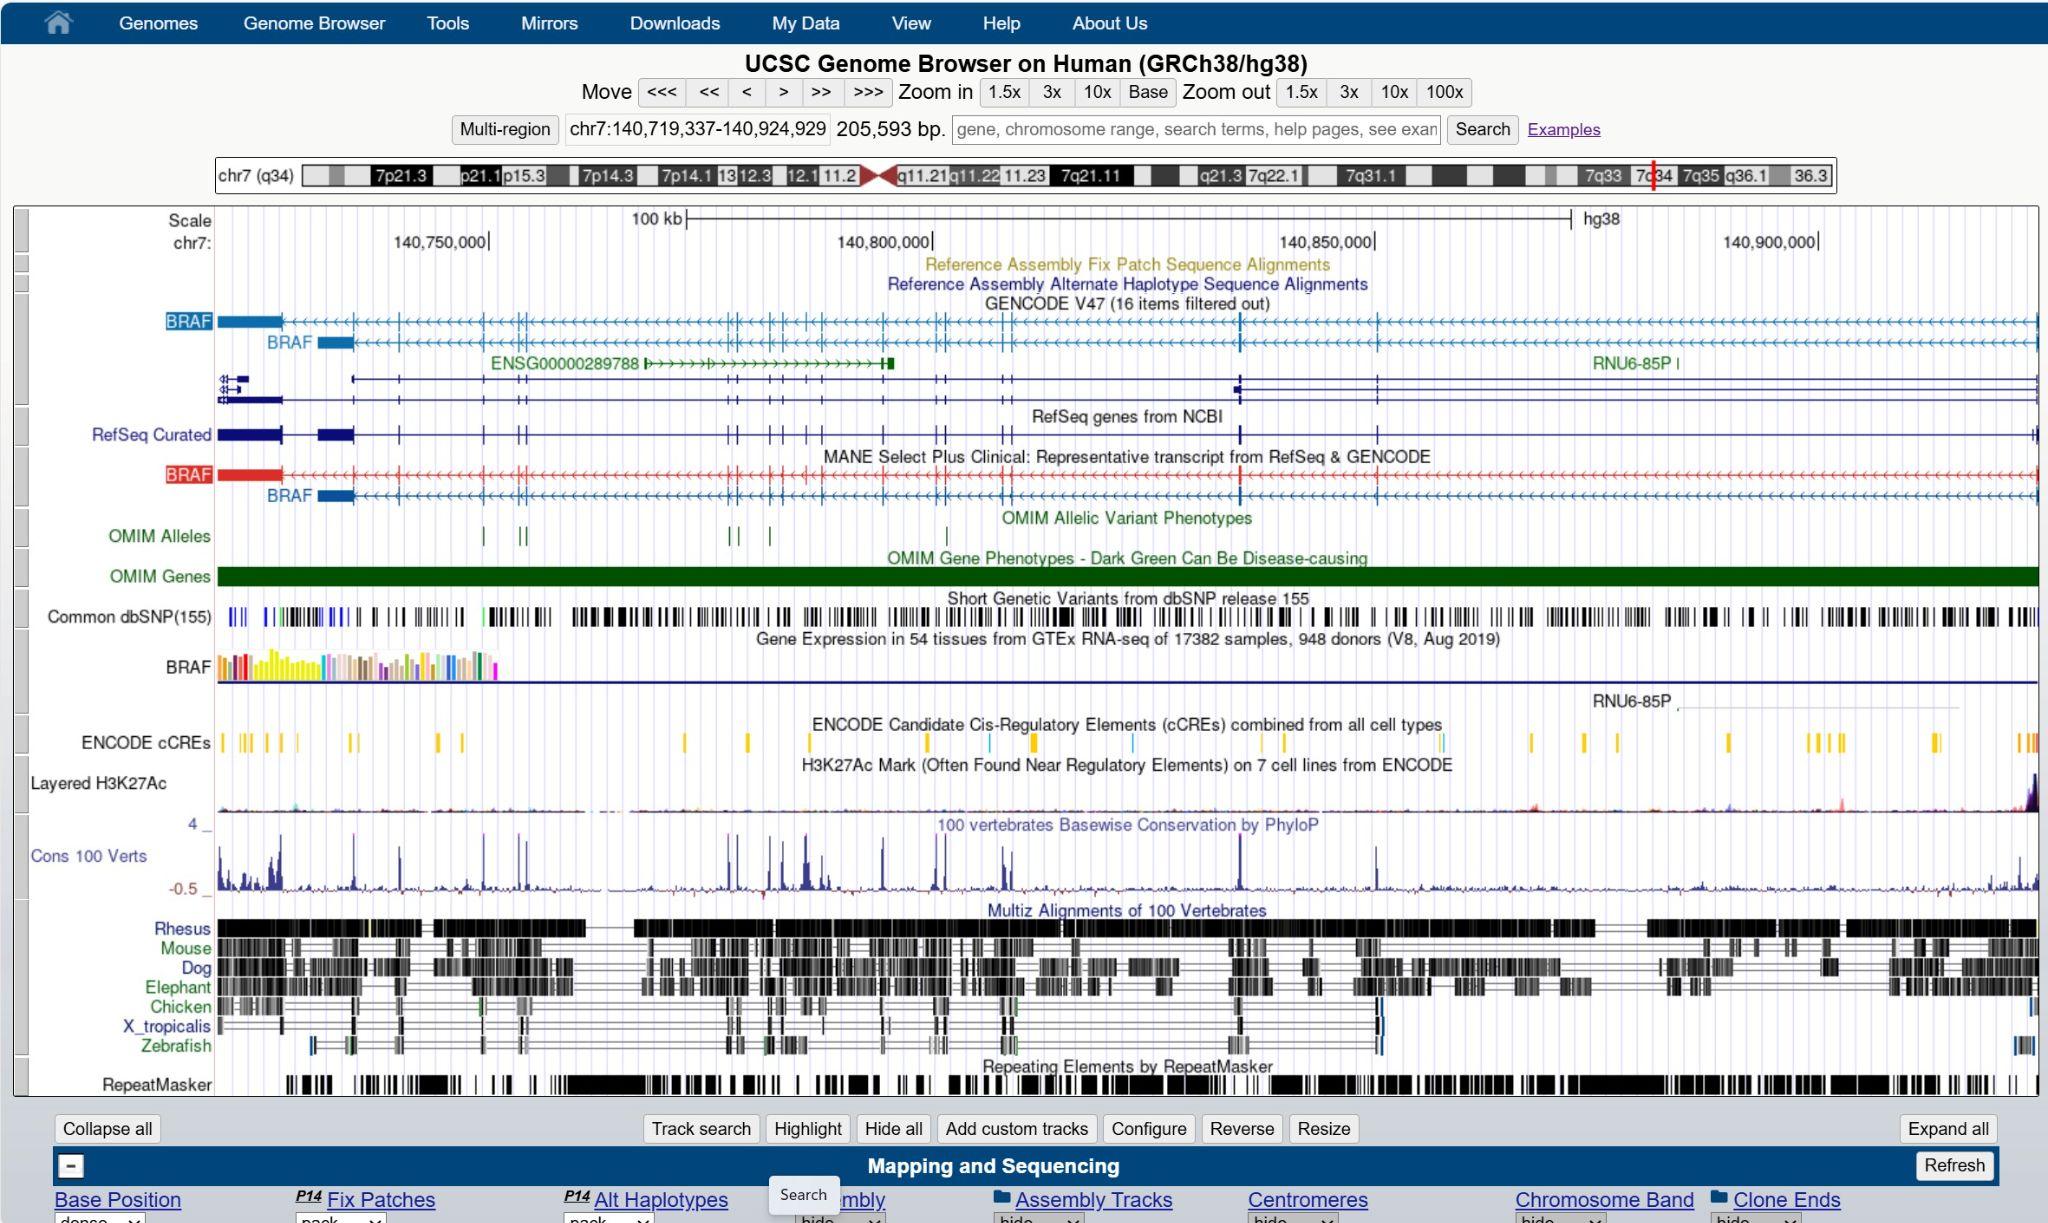
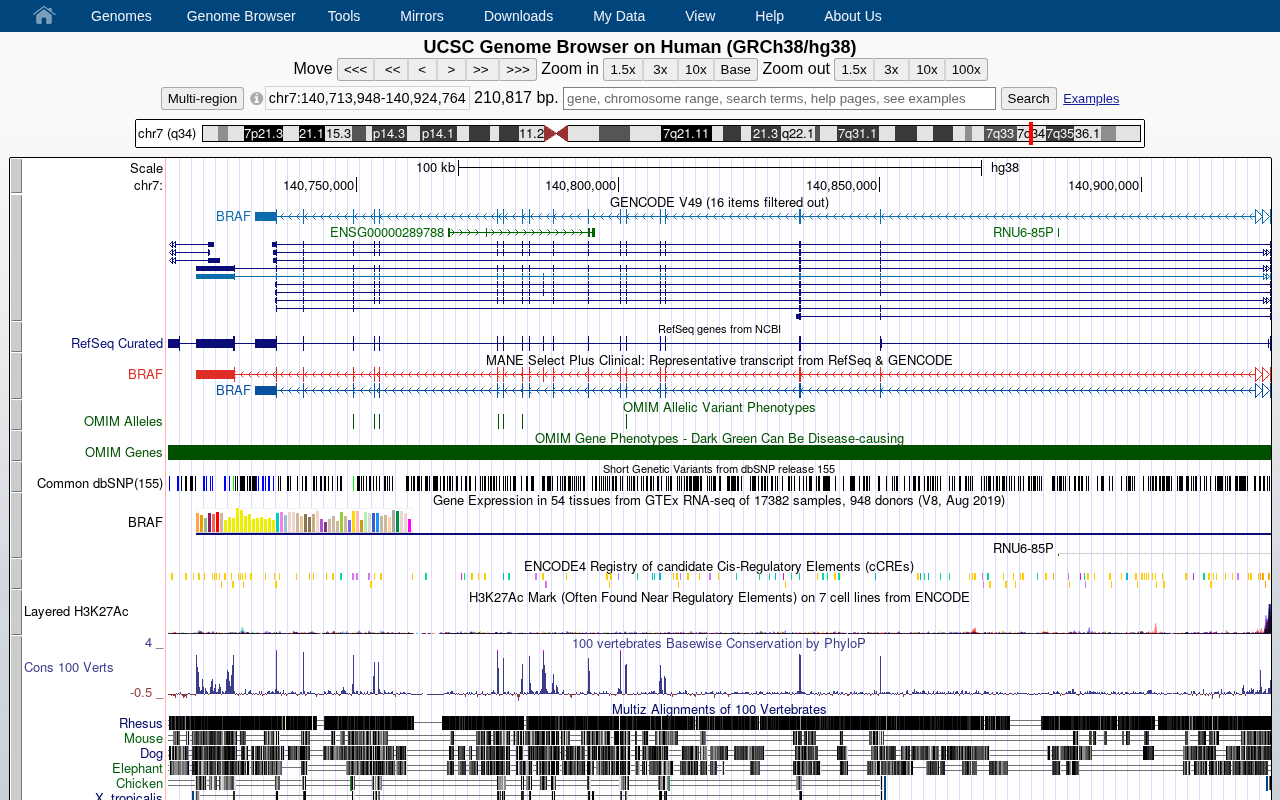
Genome Browser overview at BRAF
Default view at BRAF (hg38): blue menu bar, search box, chromosome ideogram, and stacked tracks (genes, variants, expression, regulation, conservation).

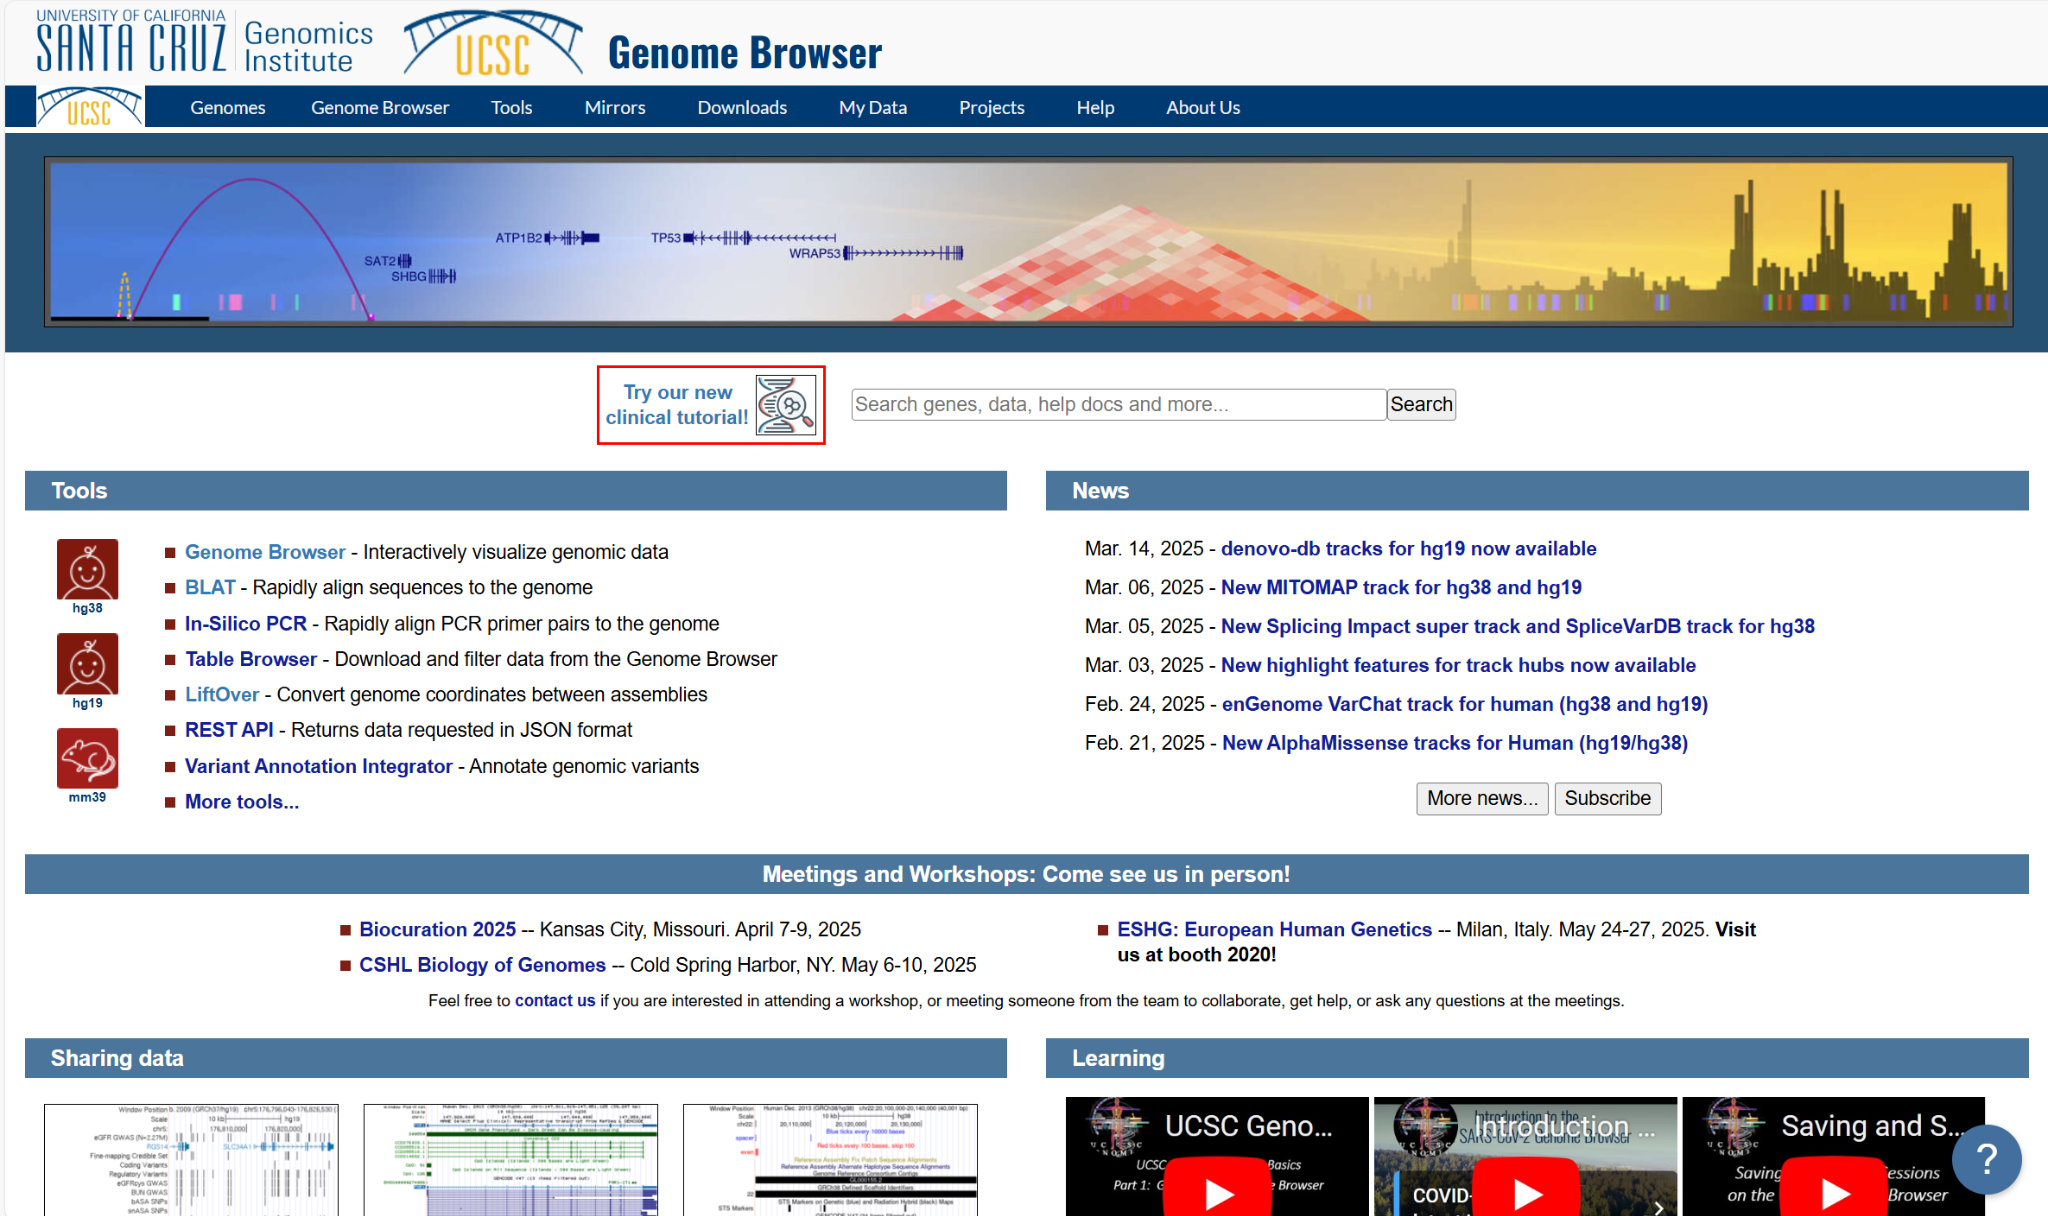
The home page & the blue menu bar

  • The blue menu bar appears on every page.
  • Genomes → jump to the Browser, or to the Gateway to pick an assembly.
  • Tools · My Data (your tracks & sessions) · Downloads · Help.
  • News on data/software changes & upcoming conferences.
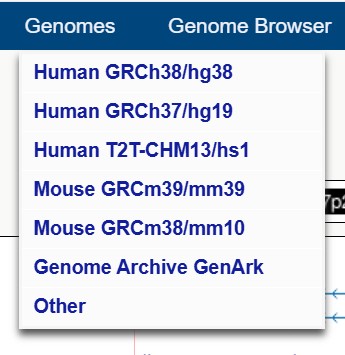
Genomes drop-down menu
The Genomes drop-down.
UCSC Genome Browser home page

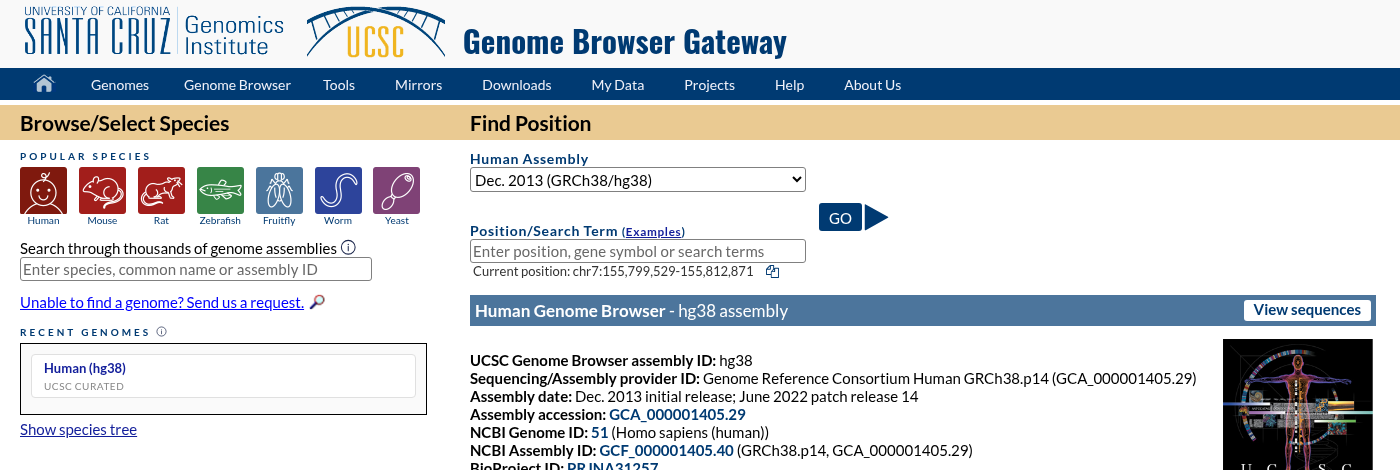
The Gateway: pick an assembly & search

Genome Browser Gateway page
The Gateway: choose a genome on the left, set the assembly and enter a gene / position / term on the right, then press GO.
  • Left: popular species, a box to search thousands of assemblies, and your Recent Genomes and connected hub assemblies. “Show species tree” opens the full tree.
  • Right: the assembly drop-down and a search box for a gene, position, or sequence. Over 50,000 assemblies in all.
  • We use hg38; hg19 is still common clinically — pick the right build first.
Try it Genomes → Human GRCh38/hg38. Search BRAF, press Enter.

The search box takes more than gene names

  • Gene symbol: BRAF
  • A feature within a gene: SOX2 exon 2
  • Position: chr7:140,753,300-140,753,400
  • dbSNP: rs113488022 · HGVS: NM_004333.6:c.1799T>A
  • A pasted DNA sequence (runs BLAT)
  • ClinVar / RefSeq / GENCODE accessions
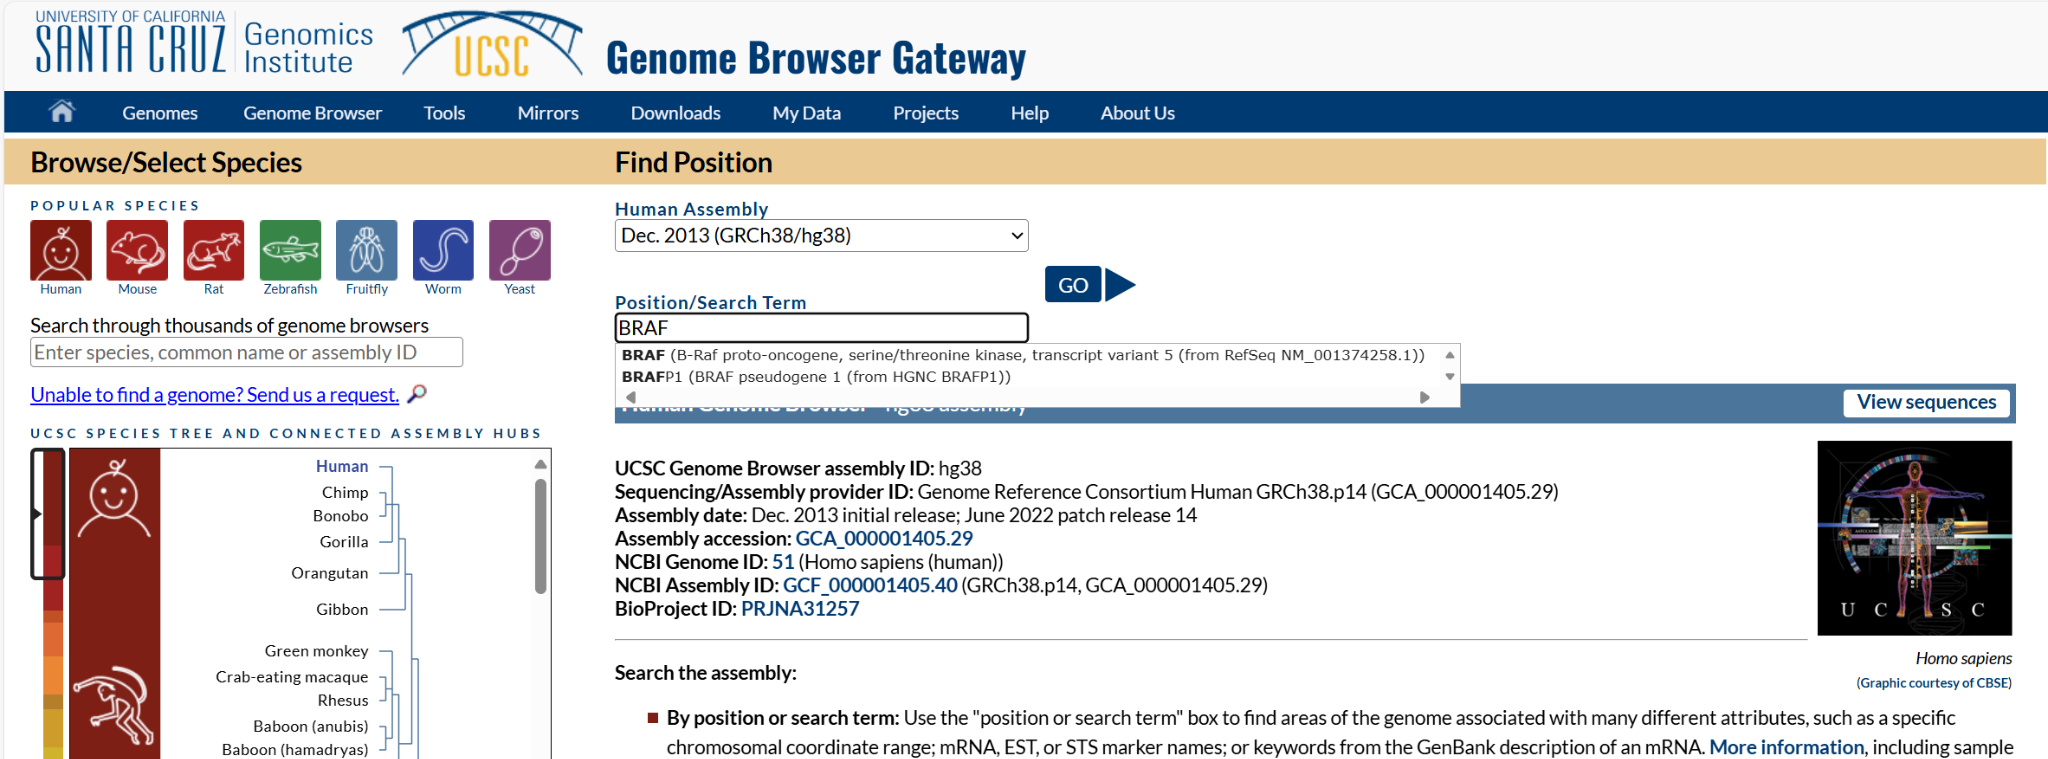
Two ways to search Quick jump: pick the gene from the drop-down. Full search: press Enter / “Search” to scan all tracks & the whole site.

The “Examples” link by the box lists every accepted format.

Gateway search example for BRAF
Searching BRAF: the quick-jump drop-down offers matches; pressing Enter runs a full search.

Navigation & viewing controls

Shift + drag to zoom or highlight

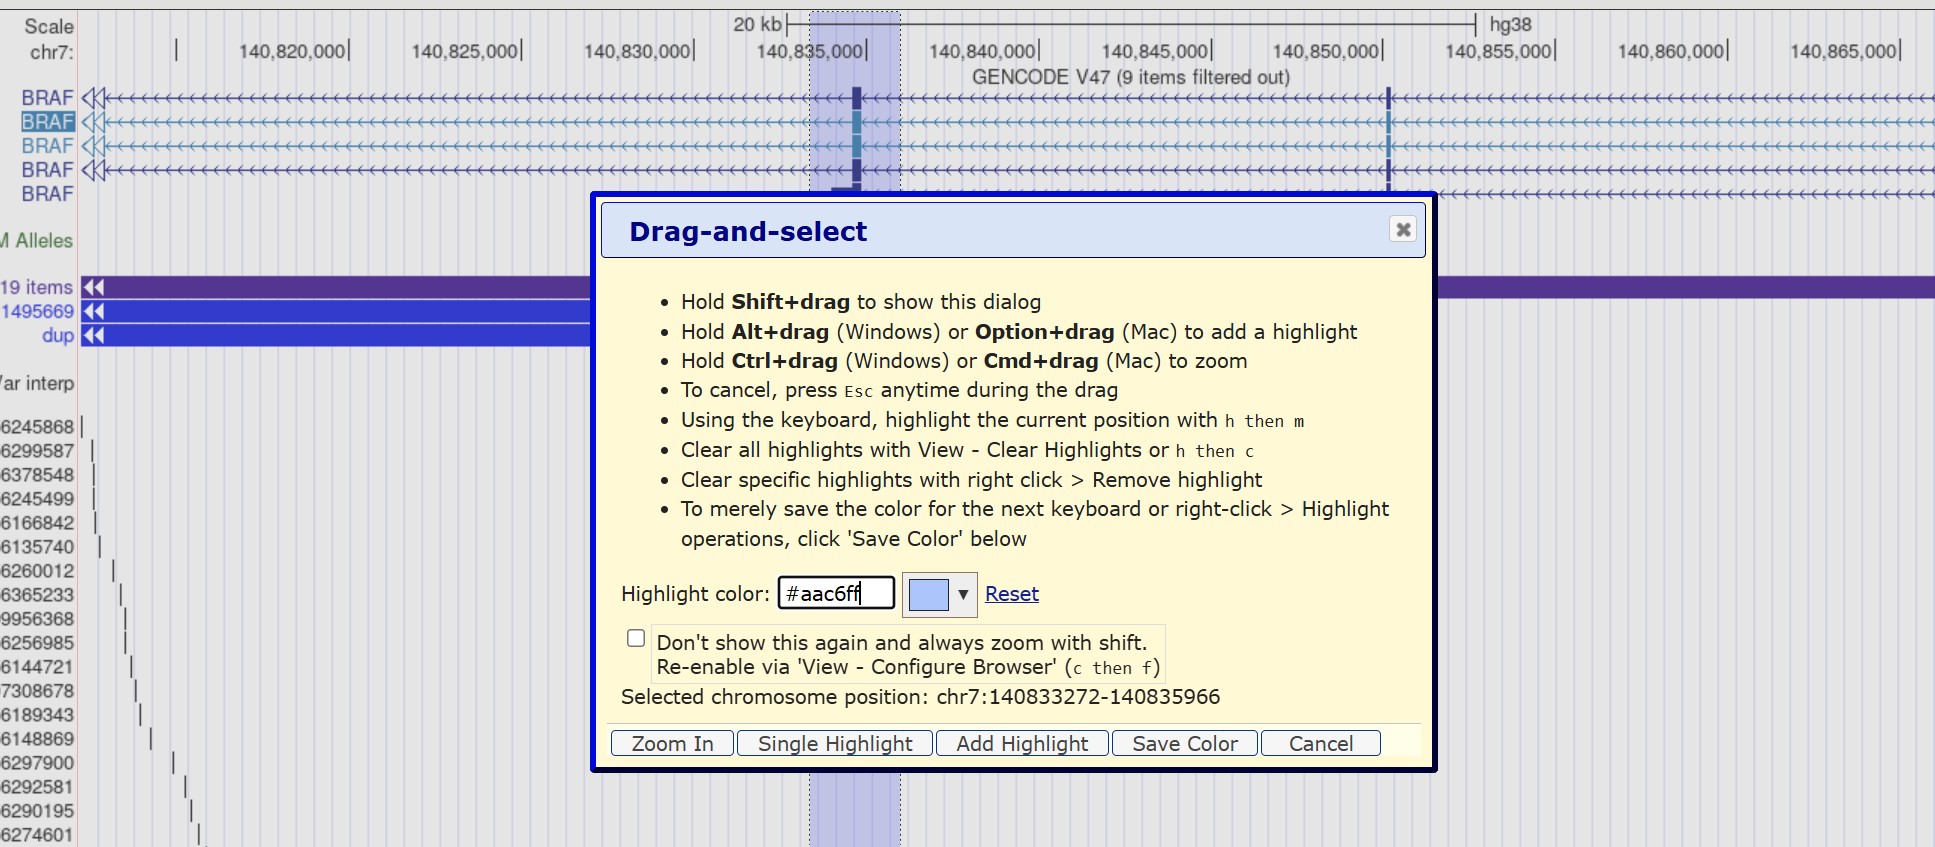
  • Shift + drag across the image opens the Drag-and-select dialog: Zoom In to that range, or add a coloured highlight you can keep.
  • Alt-drag (Windows) / Option-drag (Mac) adds a highlight directly.
  • Ctrl-drag (Windows) / Cmd-drag (Mac) zooms straight to the selected range.
  • Clear highlights via View → Clear Highlights.
Try it Shift-drag over a BRAF exon → Add Highlight, pick a colour.
Drag-and-select dialog
Shift-drag → Drag-and-select: zoom to the region, or highlight it in a colour that persists across views.

Tracks & display

Tracks and display modes

  • The track image is where every annotation is drawn.
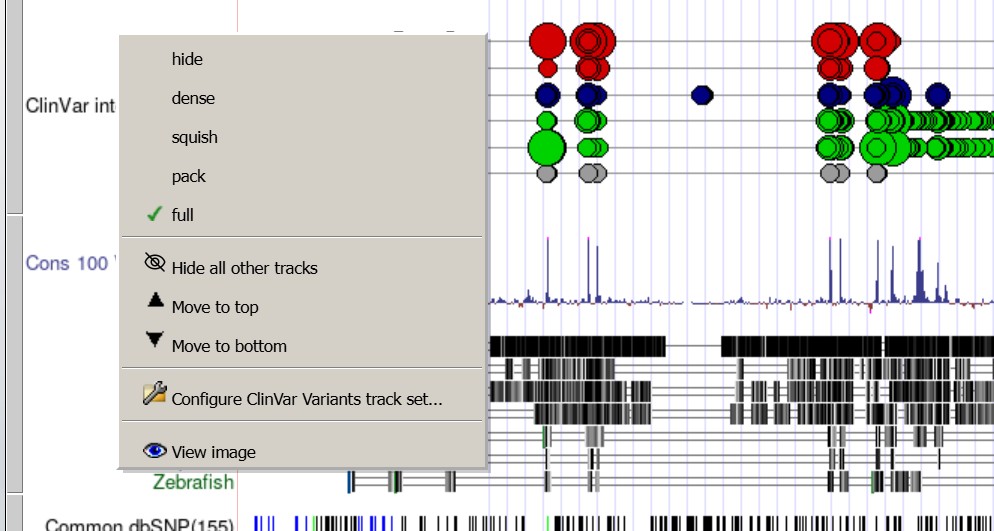
  • Right-click a track for options: visibility, configure, reorder, hide others.
  • Each track controls its own height/detail via its visibility mode.
Try it Right-click a track name to open its menu.
Right-click track menu
The right-click menu: hide / dense / squish / pack / full, plus Hide all others, Move to top/bottom, Configure, View image.

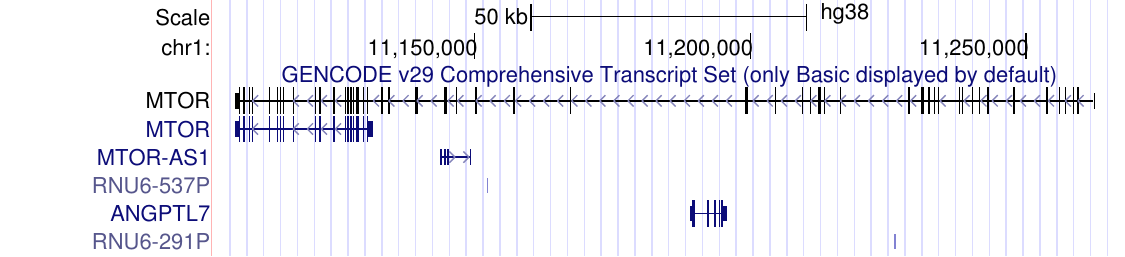
Visibility modes: “feature” tracks

  • hide: off
  • dense: all on one line
  • squish: thin, many per line
  • pack: one labelled item per row
  • full: one row per feature

Right-click a track to set its mode, configure, or reorder. (Same GENCODE region, four modes →)

densedense display mode
squishsquish display mode
packpack display mode
fullfull display mode

Visibility modes: “signal” tracks

Quantitative / “signal” tracks (wiggles, conservation, coverage) use the same menu; here it sets how the data is drawn:

  • dense: single heat-style line
  • squish / pack: compact
  • full: full-height plot with a value axis
densesignal dense
squishsignal squish
packsignal pack
fullsignal full

Get information out of a track

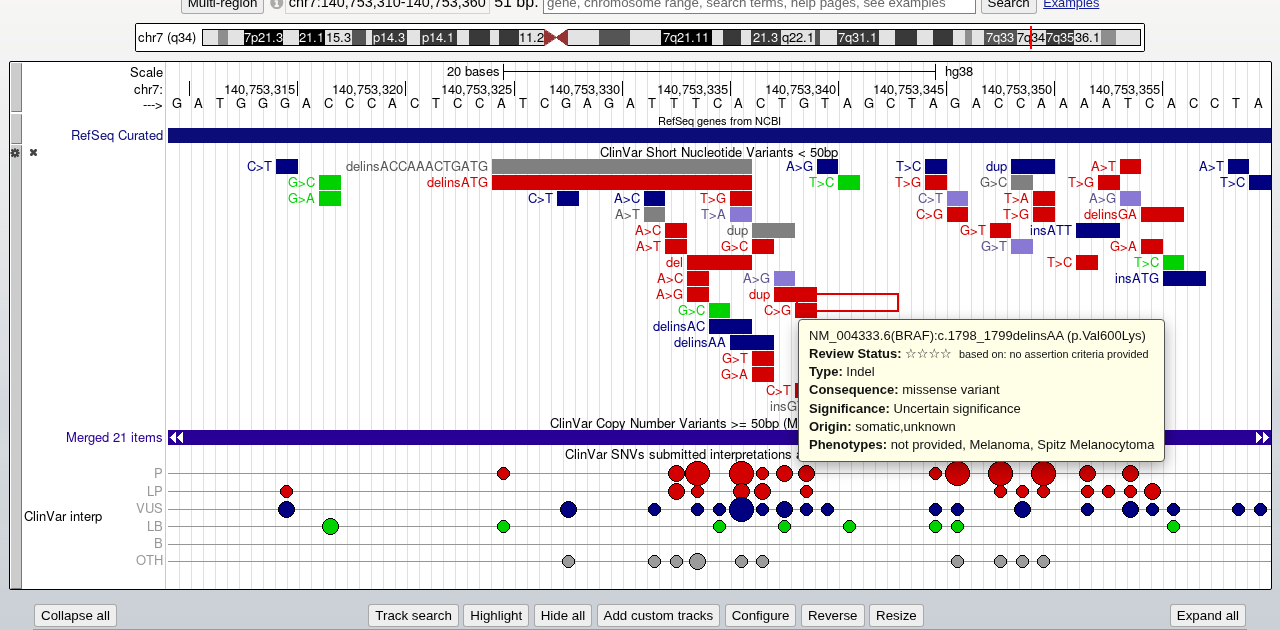
  • Mouse-over a feature for a quick tooltip.
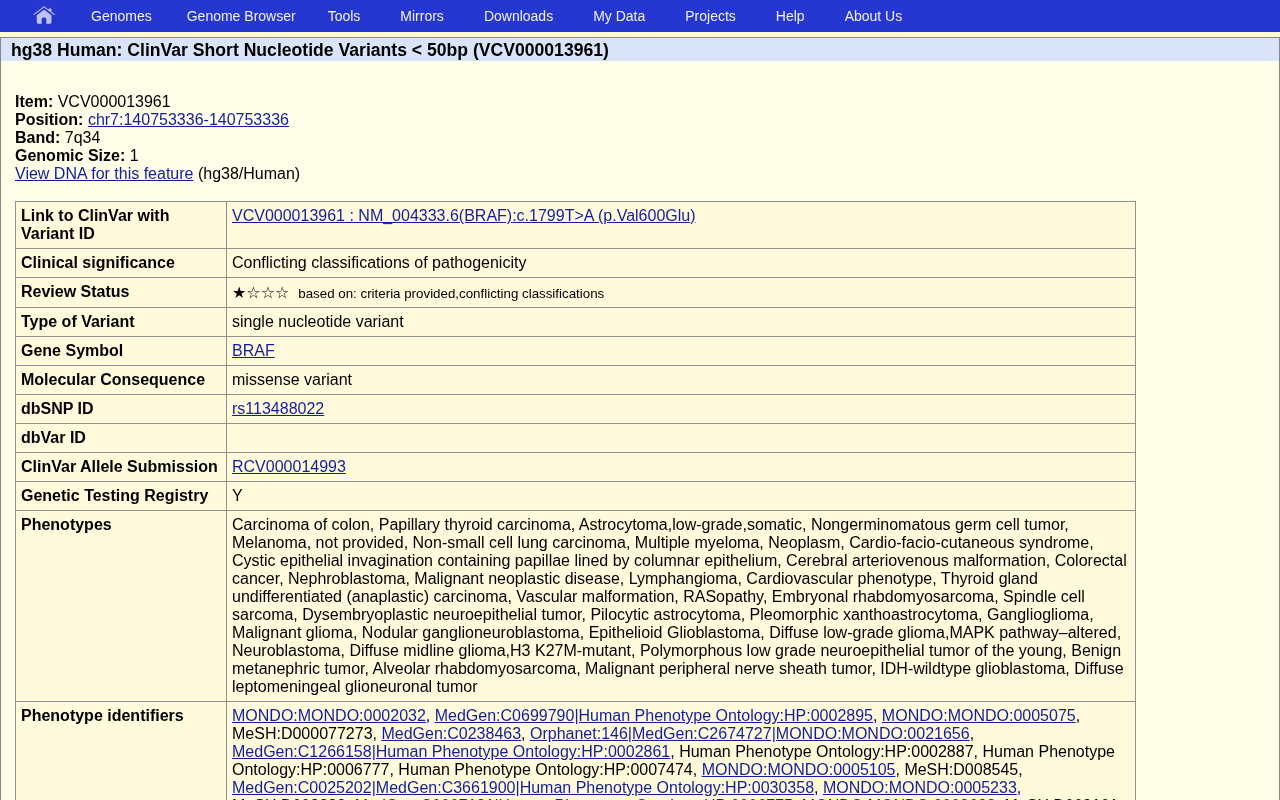
  • Click a feature → details page (significance, links, colour key).
  • Click the track name → docs & configuration.
Try it, ▶ open the BRAF V600E session Click the BRAF V600E ClinVar variant; read its details page. We work through this variant closely in Tutorial 3.
mouse-over (hover)ClinVar variant mouse-over tooltip
click → details pageClinVar details page for BRAF V600E

Mouse-over for quick descriptions

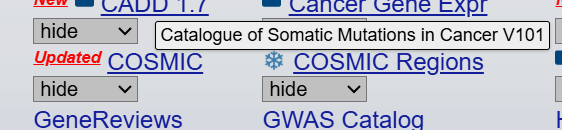
  • Hover a track name (in the controls) → a one-line description of what it is.
  • Hover a feature → its key facts without clicking.
  • The fast way to learn an unfamiliar track before turning it on.
COSMIC track-name mouse-over
OMIM track-name mouse-over

Gene interpretation

Zoom to bases, but BRAF is on the (–) strand

Genome bases C-A-T, codons do not match amino acid
Genome reads C·A·T (left→right): it does not match the amino acid M. The displayed genome codons are wrong for a (–)-strand gene.

Click Reverse (below the image) → correct view

Reversed view: A-T-G = Met, start codon green
Now it reads A·T·G = Met, the start codon highlighted green, codons line up with the protein.
Try it, ▶ open BRAF at the start codon Zoom to bases, then hit Reverse to line up the codons.

Track groups = the menu of data (1/3)

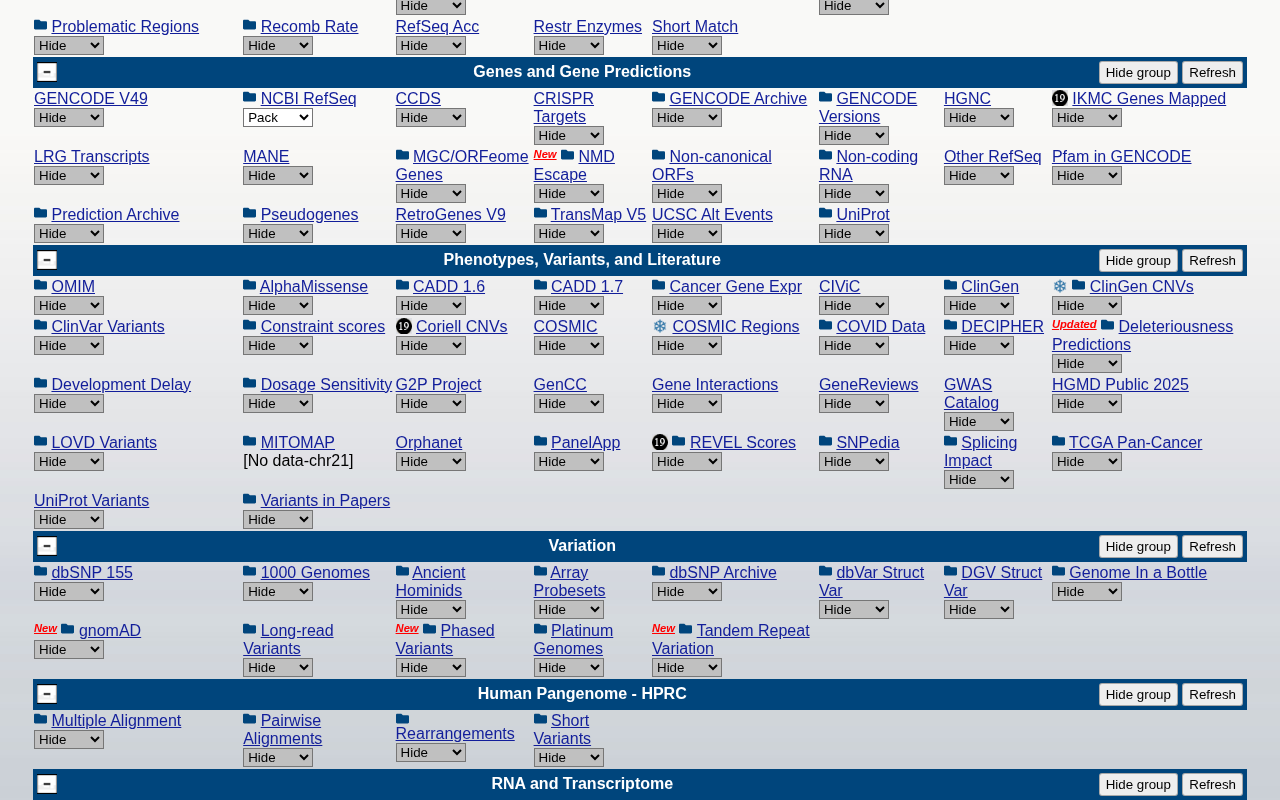
Below the image, every track sits in a labelled group, your menu of data:

  • Genes & Gene Predictions GENCODE, RefSeq, MANE
  • Phenotype, Variants & Literature ClinVar, COSMIC, CIViC…
  • Variation dbSNP, gnomAD
  • Expression · Single Cell · Regulation
  • Comparative Genomics · Repeats
Track controls with per-track visibility dropdowns
The track-controls area under the image: each track has a visibility dropdown, organised by group. Don’t panic at the volume. The Recommended Track Sets (next) help.

A tour of the track groups (2/3)

  • Mapping & Sequencing assembly, sequence, gaps, GC%
  • Genes & Gene Predictions GENCODE, NCBI RefSeq, MANE, Pfam domains, pseudogenes
  • Phenotype, Variants & Literature clinical / cancer DBs: ClinVar, COSMIC, HGMD…
  • Variation observed variants, no disease claim: dbSNP, gnomAD
  • Human Pangenome (HPRC) alignments, references & variants from the pangenome project

A tour of the track groups (3/3)

  • mRNA & EST older transcript-support assays
  • Expression RNA-seq & promoters: GTEx across tissues
  • Single Cell RNA-seq by tissue / cell type
  • Regulation enhancers & promoters, largely from ENCODE
  • Comparative Genomics cross-species genome alignments & conservation
  • Repeats RepeatMasker, satellites, segmental dups
Note: not all track groups will be available for all assemblies, especially non-human and non-mouse

Track documentation pages

  • Reach it two ways: click the track's name in the controls under the image, or right-click the track → Configure.
  • Shows the track's description: data, methods & references, and the colour key.
  • The same page holds the track's settings (next slide).
Try it Click the GENCODE track name; skim its description.
Track documentation page
A track’s documentation page: methods, references, colour key, and configuration controls.

Container tracks: folders of subtracks

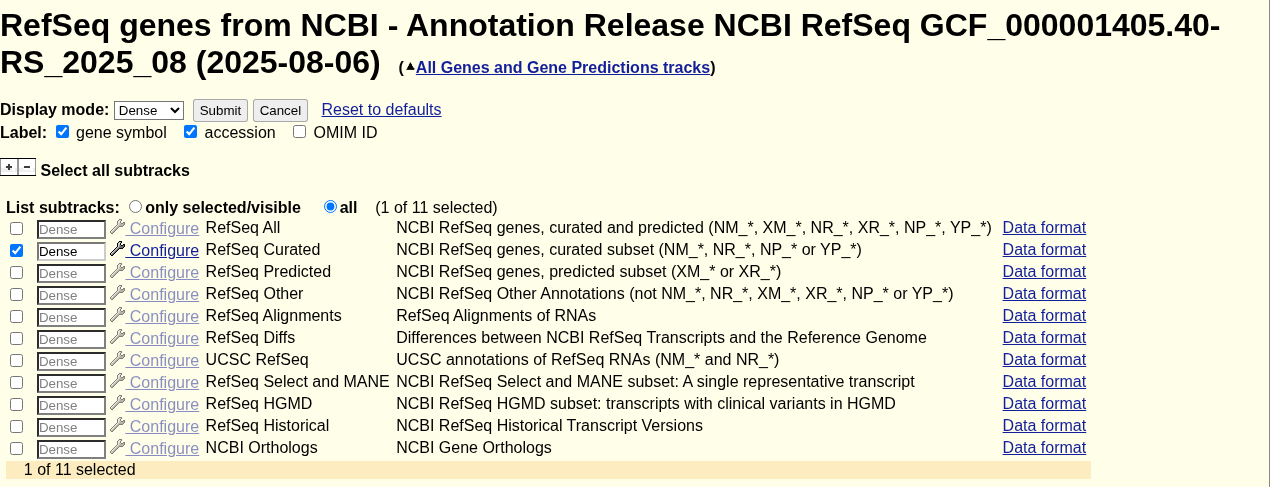
  • Many entries (like NCBI RefSeq or GTEx) are really a group of related tracks — a single line in the controls that holds a set of subtracks.
  • Open the container (click its name, or right-click → Configure) to switch its subtracks on or off and set each one’s display mode.
  • Turn the container off to hide all its subtracks at once, or on to reveal them and choose individually.
Example NCBI RefSeq is one container holding RefSeq Curated, Predicted, MANE, HGMD and more — here only RefSeq Curated is on.
NCBI RefSeq container track configuration with a checkbox list of subtracks
A container track’s settings: check or uncheck each subtrack to choose what is drawn.

Configure a track: display & filters

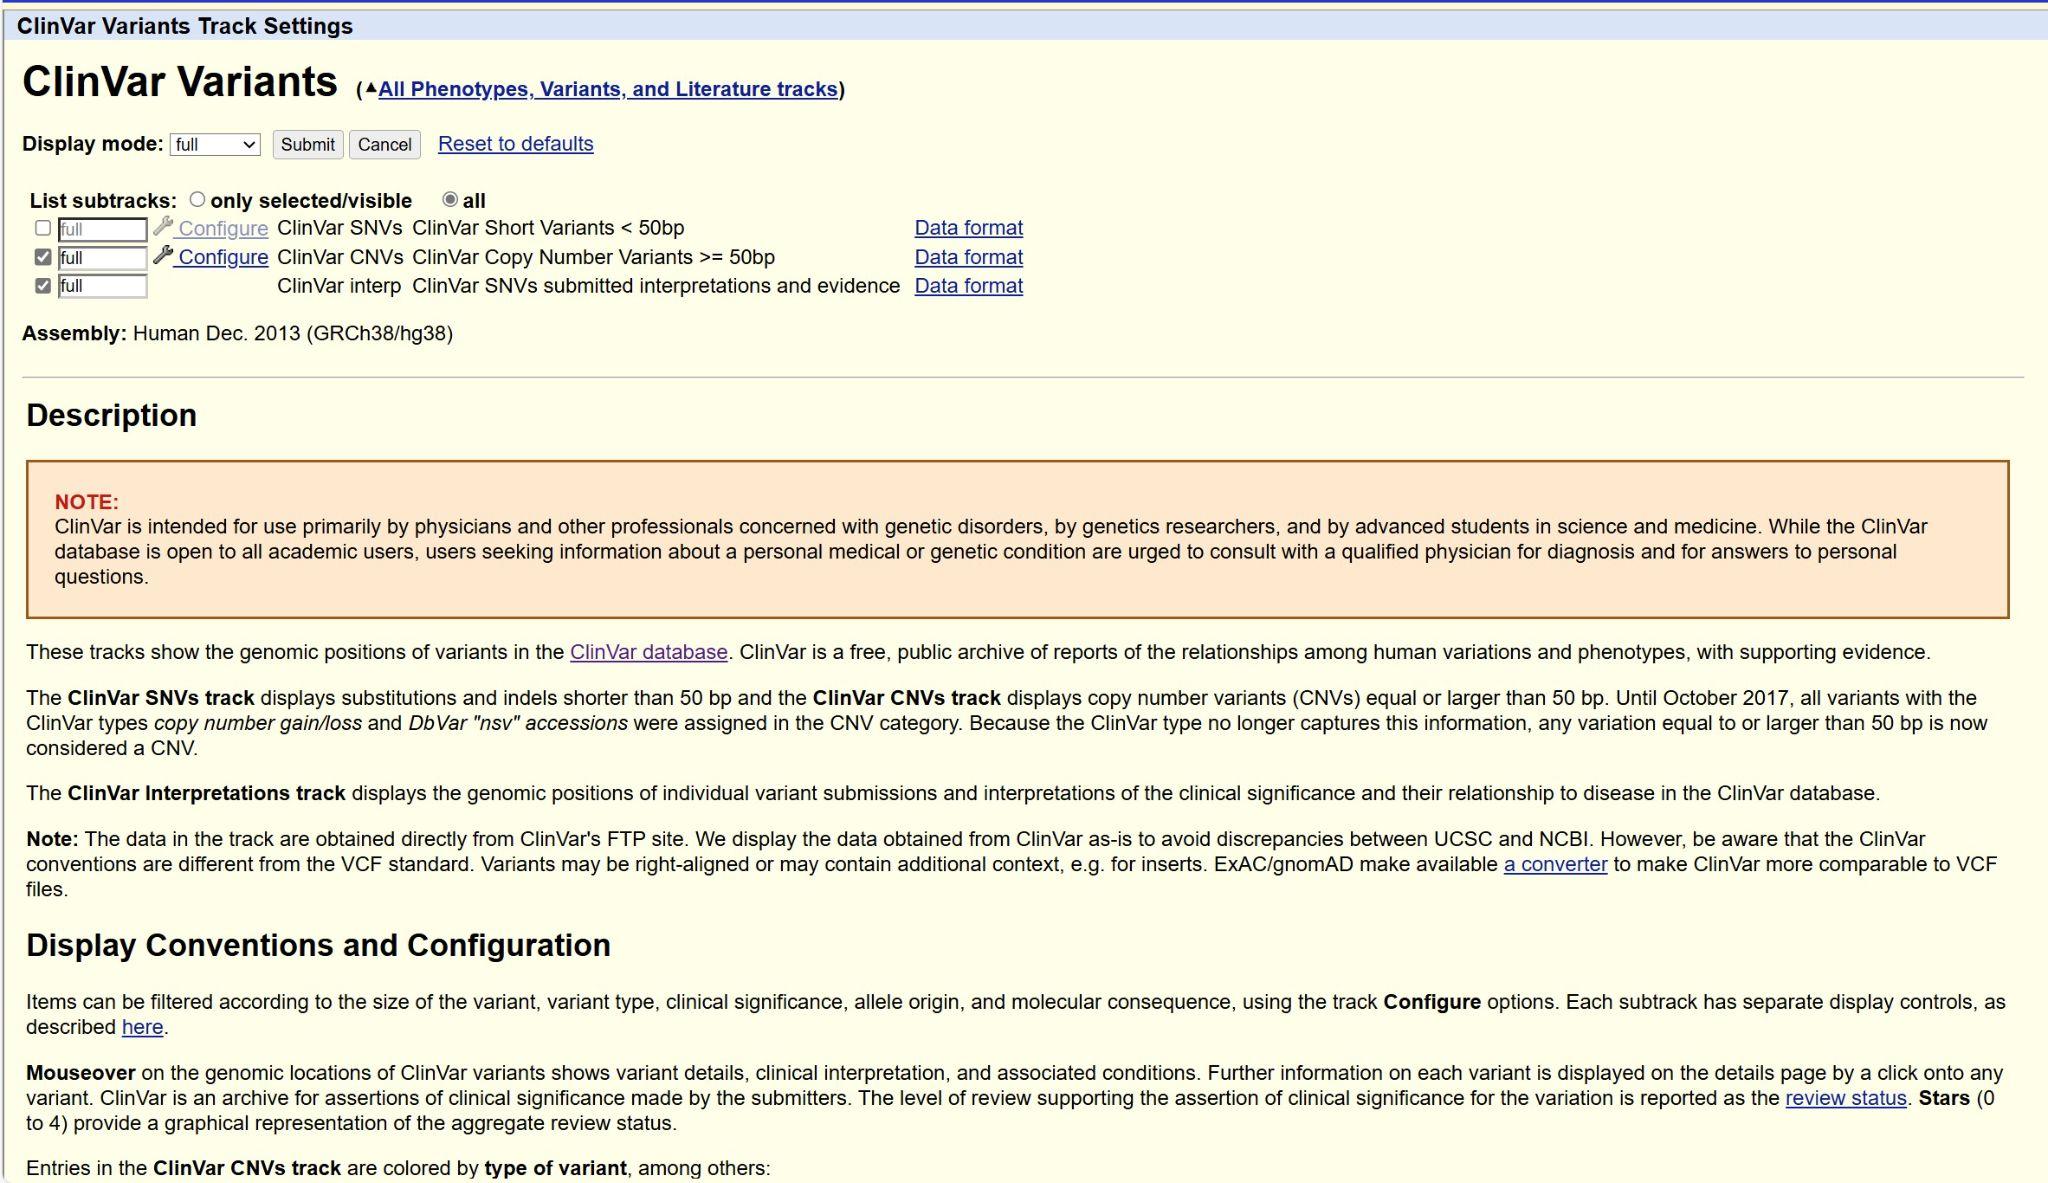
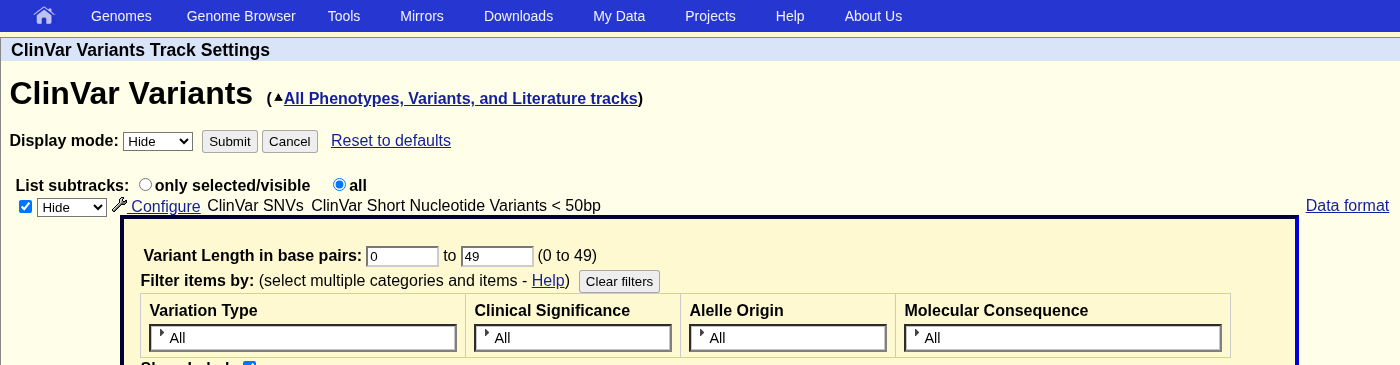
ClinVar track configuration page with filters
ClinVar’s settings page: the display mode, the boxed Filter items by controls, and colour options.
  • Set the display mode (hide → full) and track colours.
  • Filter what’s shown — here by clinical significance, variant type, allele origin, molecular consequence, and size.
  • Container tracks (a folder grouping related tracks) list their subtracks to switch on or off individually.
  • Submit applies your changes; Reset to defaults undoes them.
Try it Open ClinVar’s settings and filter to Pathogenic variants only.

Reset all tracks

  • Changed too many tracks and lost your place?
  • Genome Browser → Reset All User Settings restores the default set.
Note Reset clears your track choices, custom tracks, and connected hubs (but not your saved sessions); gives you a clean slate.
Default tracks after reset
After Reset All User Settings: the curated default set of tracks is back.

Viewing and extracting the DNA sequence

  • Want the actual bases of a gene/region? View → DNA.
  • Returns the sequence for whatever is currently in view.
Try it Zoom to a BRAF exon → View → DNA → Get DNA.
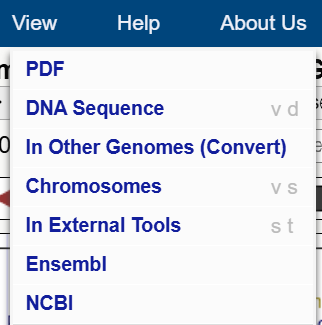
View menu → DNA Sequence
View → DNA Sequence returns the bases for the current window.

Viewing DNA: options

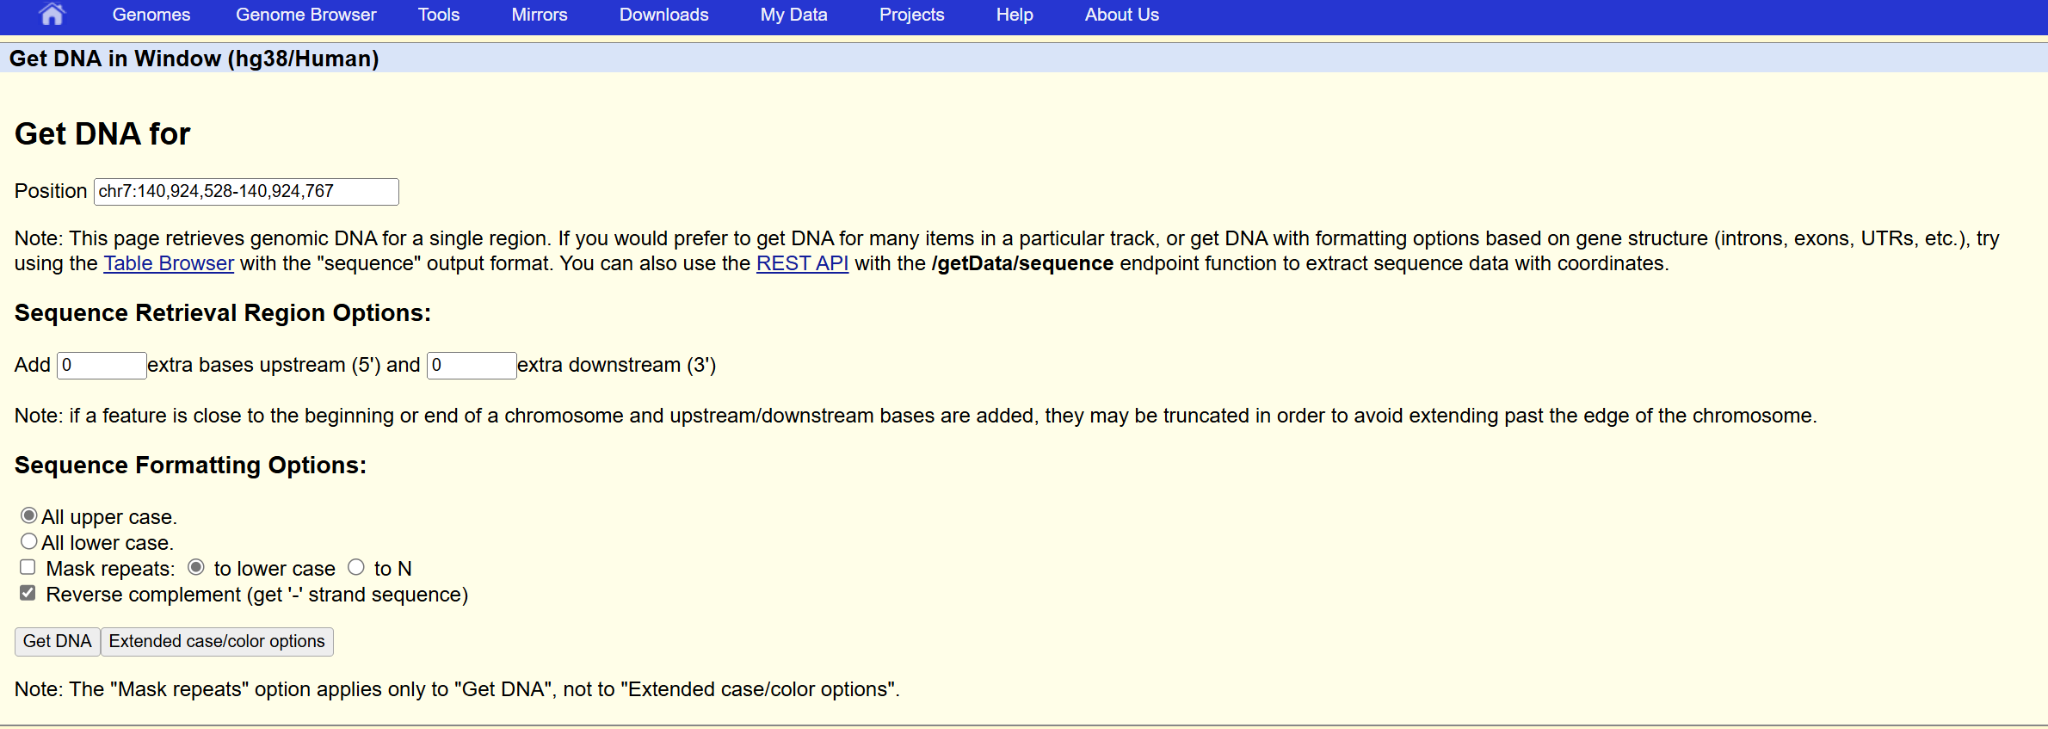
DNA sequence output page
The DNA output page: reverse-complement option, extension controls, and the retrieved sequence.
  • Reverse complement for a (–)-strand gene, then Get DNA.
  • Extend the output up- / down-stream to grab flanking sequence.
  • Feeds primer design, BLAT, cloning…

Tools: Table Browser & BLAT

get the data out, and find a sequence in the genome

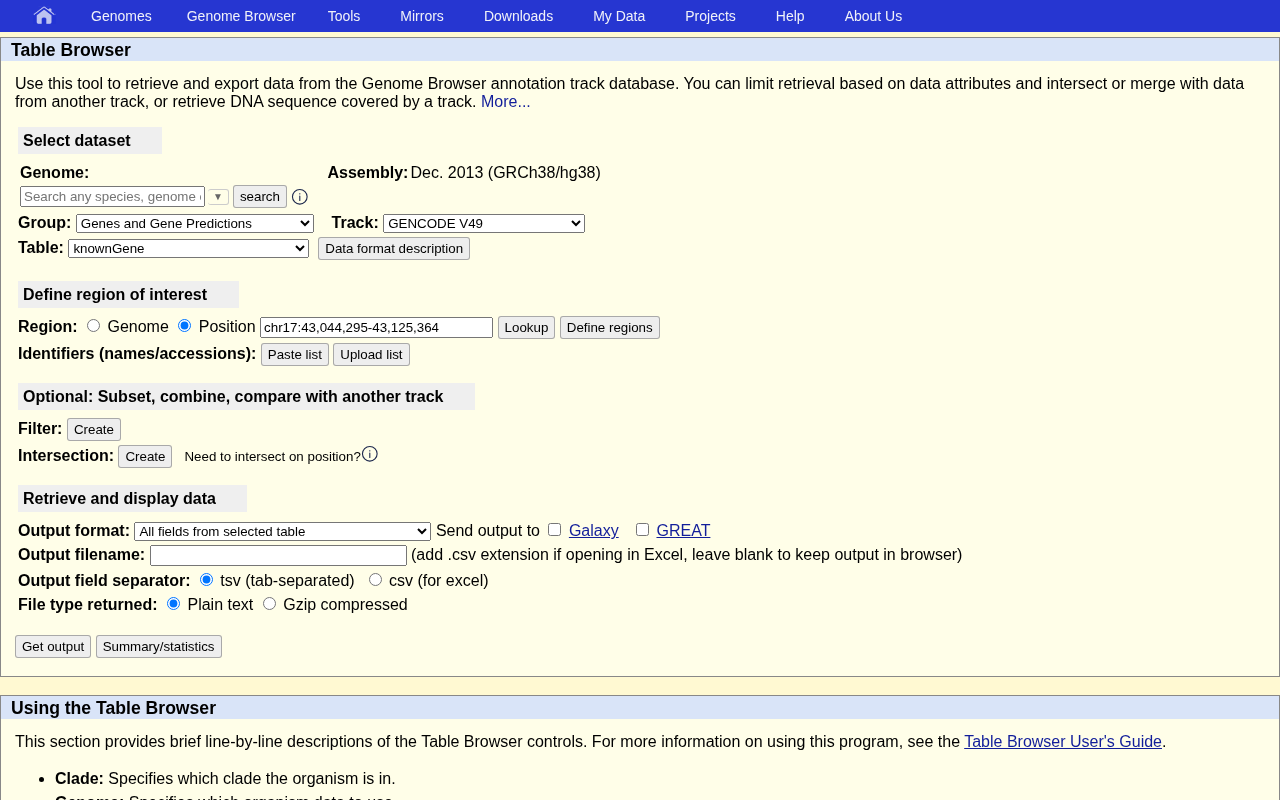
Table Browser: get the data out

  • Tools → Table Browser: a graphical interface to all the underlying Genome Browser data.
  • Get the data behind any track, as a table.
  • Restrict to a region, filter by field, intersect two tracks.
  • Download BED/CSV, send to Galaxy, or save as a custom track.
Try it, ▶ open the BRCA2 ClinVar session Export ClinVar variants in BRCA2, then intersect with GENCODE exons (or cCREs).
Table Browser form
The Table Browser: pick a track (here ClinVar on BRCA1), add filters/intersections, choose an output format.

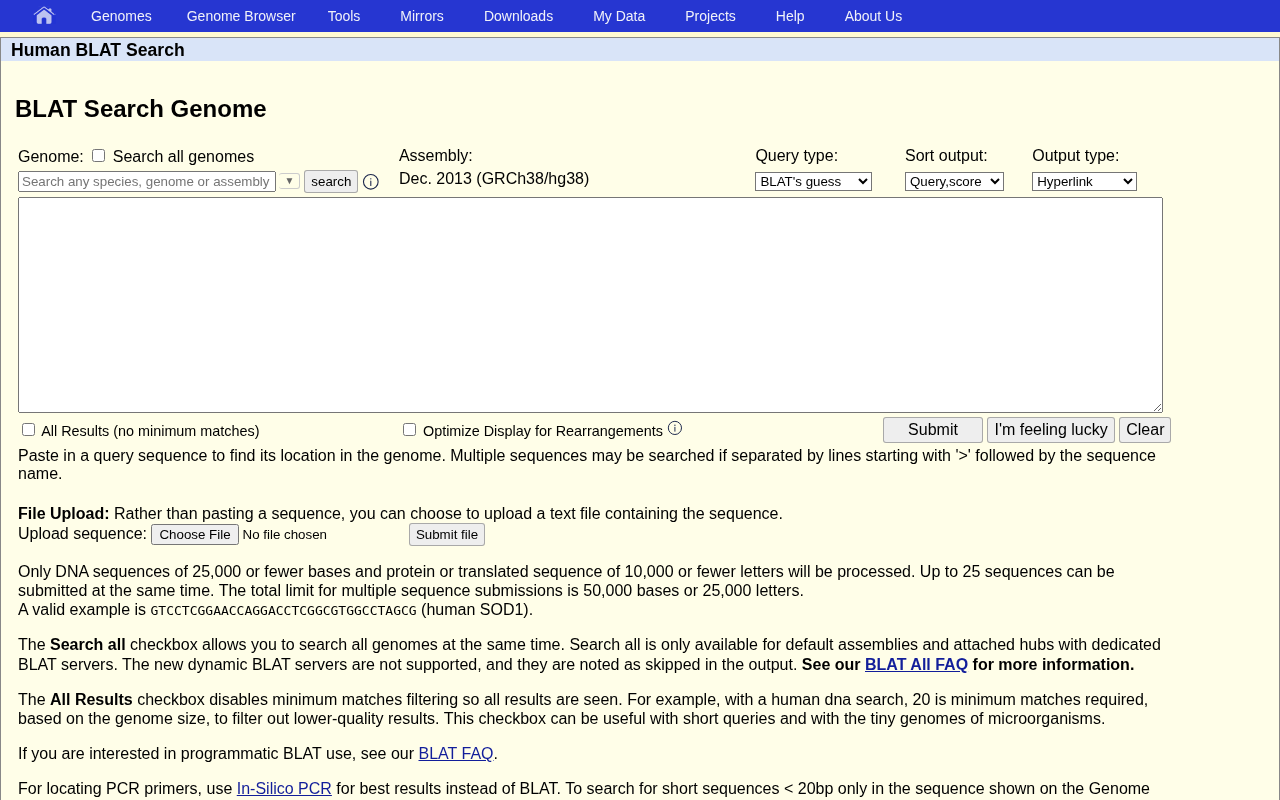
BLAT: find a sequence in a genome

  • Tools → BLAT: paste DNA/protein → its location(s).
  • Place a read, a primer, or a sequence from a paper.
  • “Search all genomes” → where it lands in other species.
Try it, paste this BRAF fragment, Submit
TGGAAAAATAGCCTCAATTCTTACCATCCACAAAATGGATCCAGACAACTGTTCAAACTGATGGGACCCACTCCATCGAGATTTCACTGTAGCTAGACCAAAATCACCTATTTTTACTGTGAGGTCTTCATGAAGAAATATATCTGAGGTGTAGTAAGTAAAGGAAAACAGTAGATCTCATTTTCCTATCAGAGCAAGCA
↓ scroll for the results
BLAT search page
The BLAT page: paste a sequence, pick this genome (or all genomes), Submit.

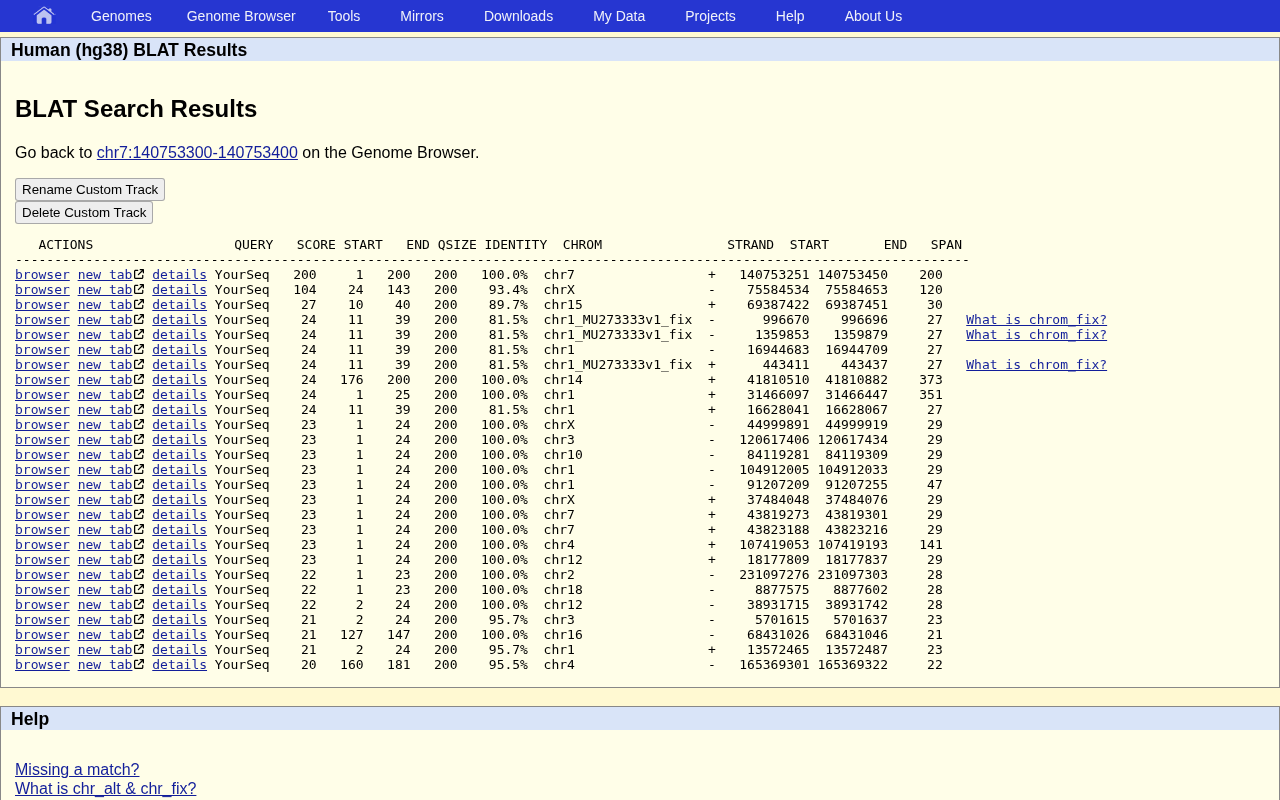
BLAT: the results

BLAT results table
Hits ranked by score & identity: our fragment hits BRAF on chr7 at ~100%. Click browser next to the top hit.

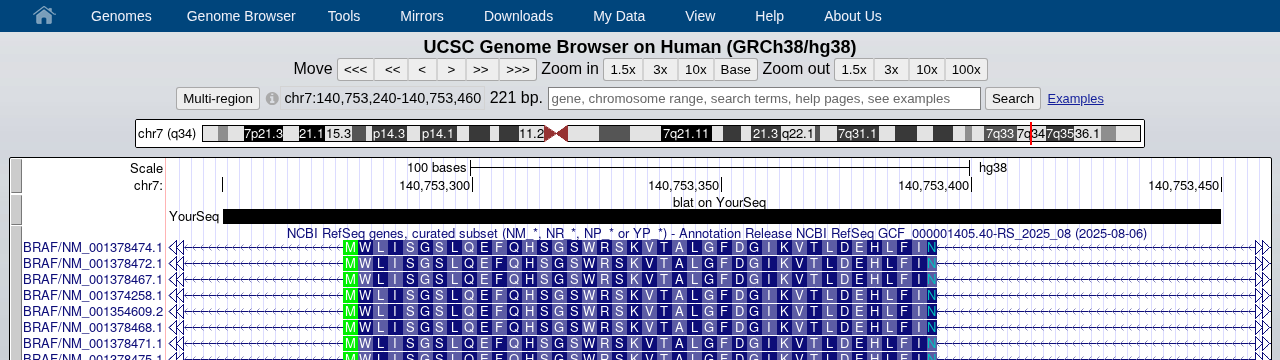
BLAT: your sequence aligned in the Browser

BLAT hit aligned on the browser
“YourSeq” aligned over the BRAF coding sequence, codons & amino acids at base resolution.
  • The query shows up as “YourSeq”, aligned to BRAF.
  • Re-run with “search all genomes” → the same sequence also hits other species (mouse and more).
Tools work cross-species BLAT runs on mouse and any other assembly, with an identical workflow.

#1 goal: “visualise my own data”

Custom tracks

put your lab’s data on the Browser

What you can load

  • Text: BED bedGraph GFF/GTF VCF WIG
  • Big binary (large data, by URL): bigBed bigWig BAM VCF+tabix .hic
  • Full list of accepted formats

Small data: paste it. Large data: host the file and give the Browser a URL.

Loading a custom track

  1. My Data → Custom Tracks
  2. Pick the assembly (hg38)
  3. Paste a track line / file URL, or upload
One-click examples: try nowLoad a VCF of variants (hg19)
Load an RNA-seq bigWig (hg38)
Try it Click the VCF example, then switch it dense ↔ full.
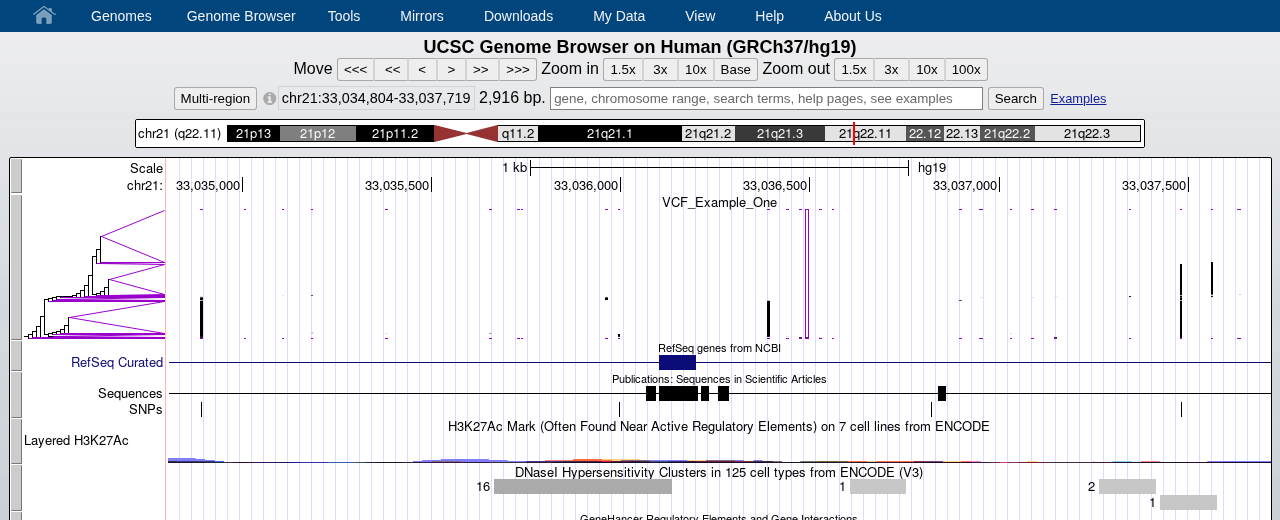
Loaded VCF custom track (1000 Genomes example, hg19)
The UCSC example VCF (1000 Genomes, hg19) loaded as a custom track, genotypes shown as a haplotype tree over the variants.

Track hubs

many tracks, organised & shareable, by one URL

Hub vs custom track

  • Custom track = a file or two; quick & personal.
  • Track hub = a structured, reusable collection of many tracks, configured once, loaded by one URL, ideal to publish or share with a lab.

Load a hub by URL

  • My Data → Track Hubs → My Hubs → paste the hub URL.
  • Or browse Public Hubs and use Hub Search.
Demo: cancer & expression hubs BRCA Exchange · ENCODE4 Regulation · FANTOM5 (multi-species).
Try it Connect a hub by URL and turn on a track. Browse the Public Hubs page.
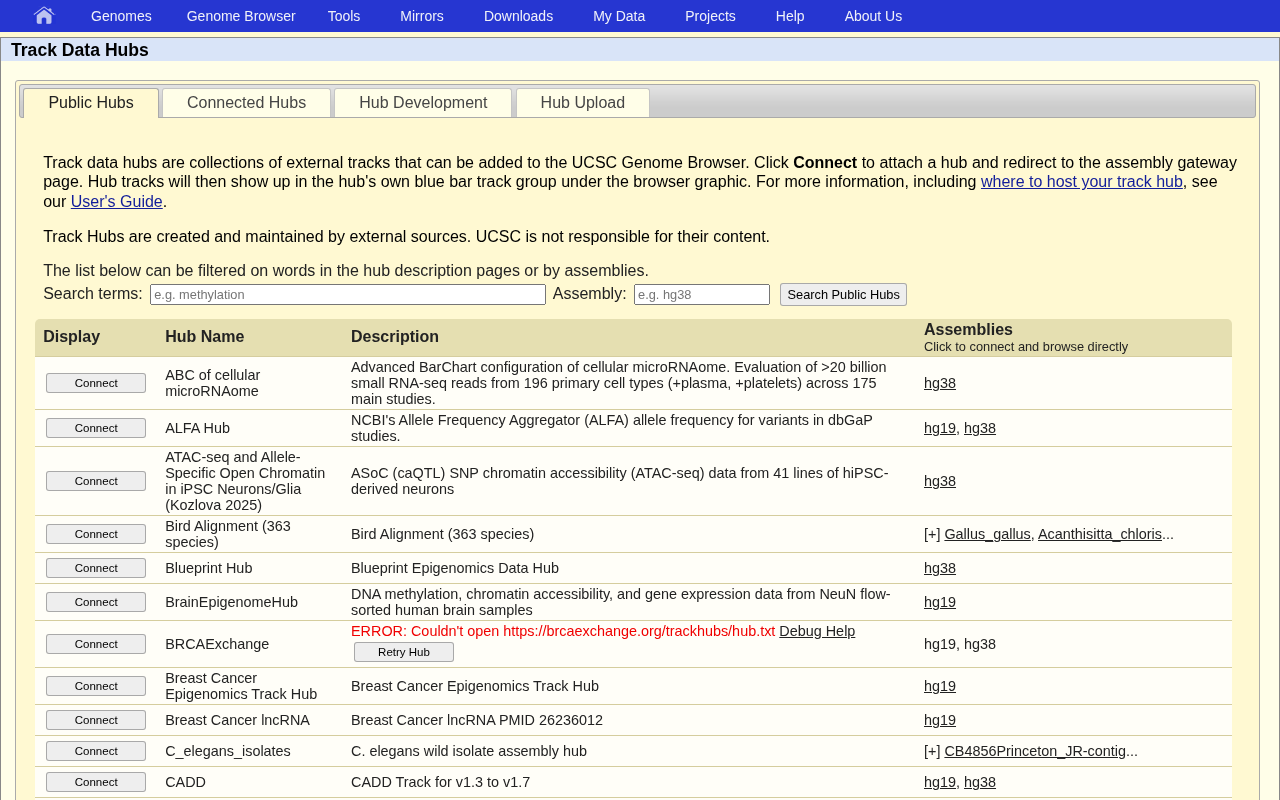
Track Data Hubs page
The Track Data Hubs page: connect your own hub by URL, or browse hundreds of curated Public Hubs with Hub Search.

Build your own (in brief)

  • Three text files: hub.txtgenomes.txttrackDb.txt, plus your big* data files.
  • Host anywhere reachable by URL; give the Browser the hub.txt link.
  • Full how-to: Track Hub Basics · take-away example file
New: free hosting: Hub Space 2026 No web server? Upload bigBed / bigWig / BAM / VCF directly on the Browser: Track Hubs → Hub Space tab (10 GB to start — email us if you need more). Announcement →

Sessions: save & share

turn any view into a stable, shareable link

Sessions: save & share a live view

  • My Data → My Sessions → name it → Submit.
  • Captures position, every track setting, your custom tracks & hubs.
  • Stable short link: genome.ucsc.edu/s/user/Name

Drop it into emails, papers, figure legends, posters, class handouts.

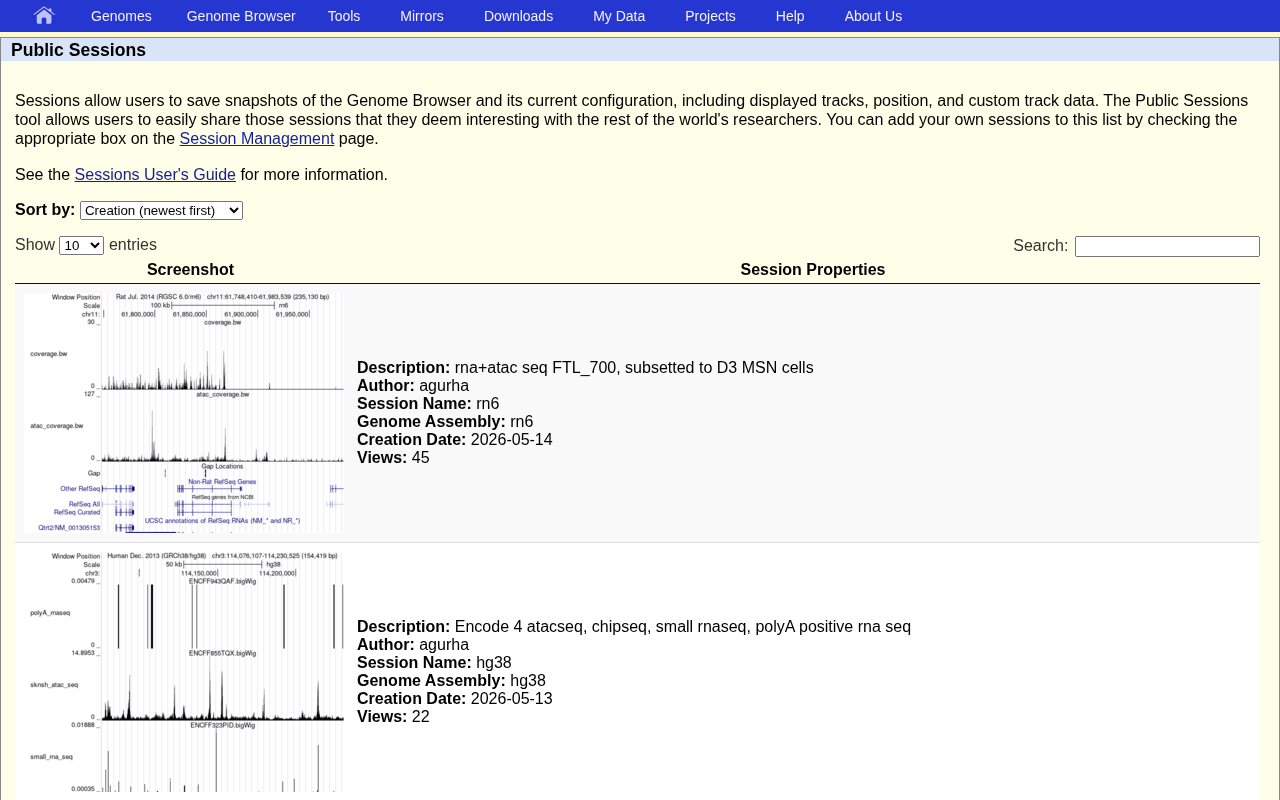
Public Sessions gallery
Public Sessions: researchers share snapshots: each is a full Browser view (tracks, position, custom data) behind one link.

Sessions = collaboration & teaching

  • Some of you want to teach with the Browser: a link gives every student the same starting view.
  • The BRCA·ENIGMA expert-panel set (Tutorial 3) shared its whole analysis as a session.
Try it Save your current view as a session and copy its short link.

What you can now do

  • Navigate the Browser and read any track & gene model.
  • Set track visibility, use the track groups, and reset to defaults.
  • Extract DNA, query the Table Browser, and place a sequence with BLAT.
  • Load your own data as custom tracks and hubs, and save & share a session.
Next Tutorial 2 (Cancer Data) tours the clinical databases; Tutorial 3 puts them to work on real variants.
Where to get help

Who are we?

  • The UCSC Genome Browser, based in Santa Cruz, California.
  • Online since 2000.
  • A small team, building a free, public resource used worldwide.
Acknowledgement Funded by the National Human Genome Research Institute (NHGRI) of the NIH.
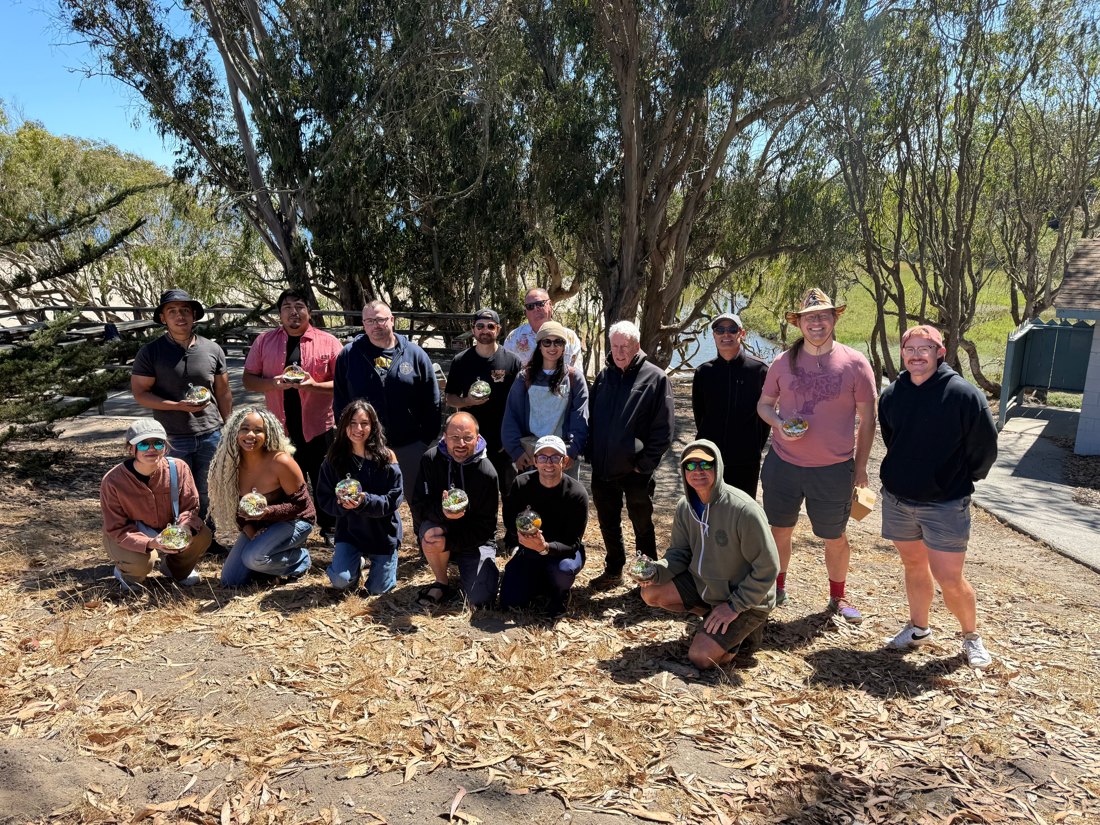
UCSC Genome Browser team, July 2025
The UCSC Genome Browser team, July 2025.

Thank you!

Questions? · genome@soe.ucsc.edu

UCSC Genome Browser · genome.ucsc.edu